For the cold days a little
data science advent calendar.
All gifts are mainly for python or pandas 🎅:
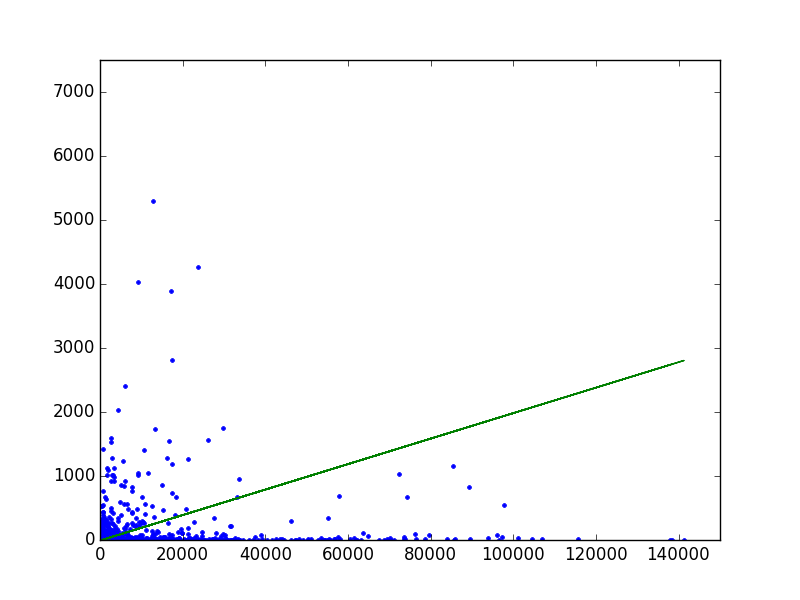
01: Remove outliers
The first door is a one-liner:
df[np.abs(df.Data-df.Data.mean())<=(3*df.Data.std())]
#Remove outliers that are not within +3 to -3 standard deviations in the column 'Data'.
Source
Software used:
- Python
- Pandas
- Numpy
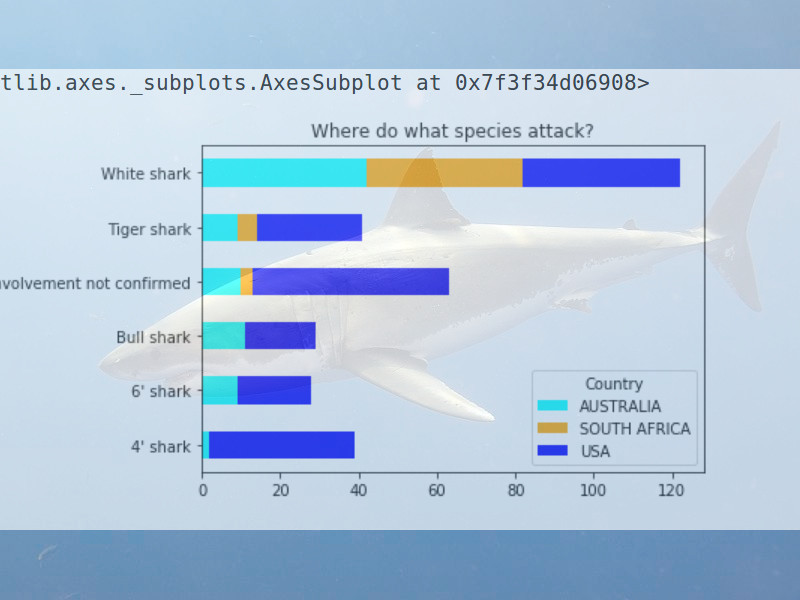
02: Global Shark Attacks
The second door is a small EDA:
How dangerous are sharks?
Link to Jupyter Notebook
Software used:
- Python
- Pandas
- Matplotlib
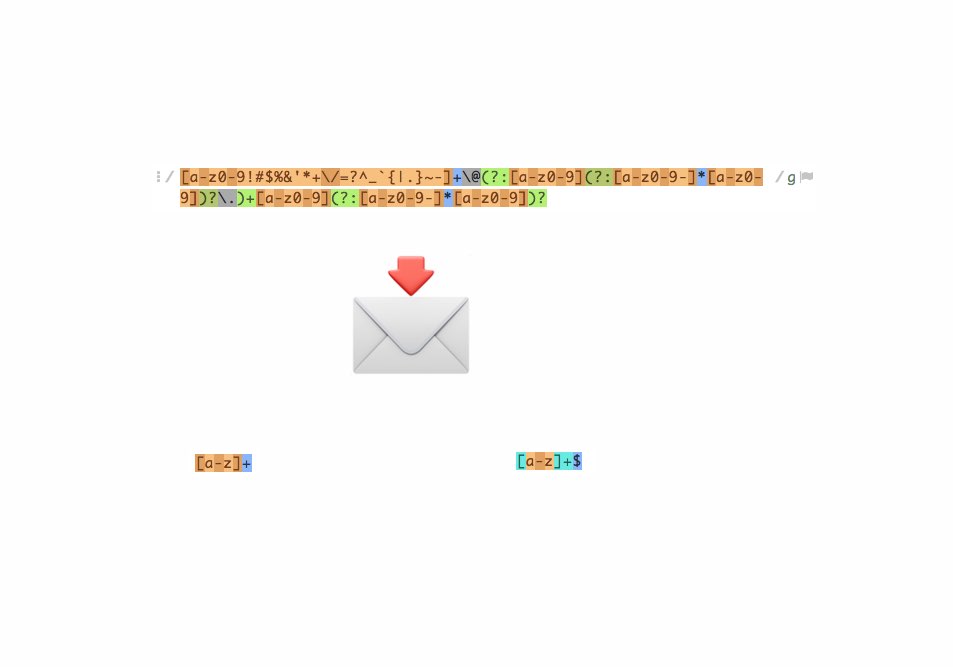
03: RegEx E-Mail-Address matching
The third door is a common regex for emails:
email = re.compile(u"([a-z0-9!#$%&'*+\/=?^_`{|.}~-]+@(?:[a-z0-9](?:[a-z0-9-]*[a-z0-9])?\.)+[a-z0-9](?:[a-z0-9-]*[a-z0-9])?)", re.IGNORECASE)
print(email.match("test@mail.com"))
Source: The common regex library
Software used:
- Python
- RegEx
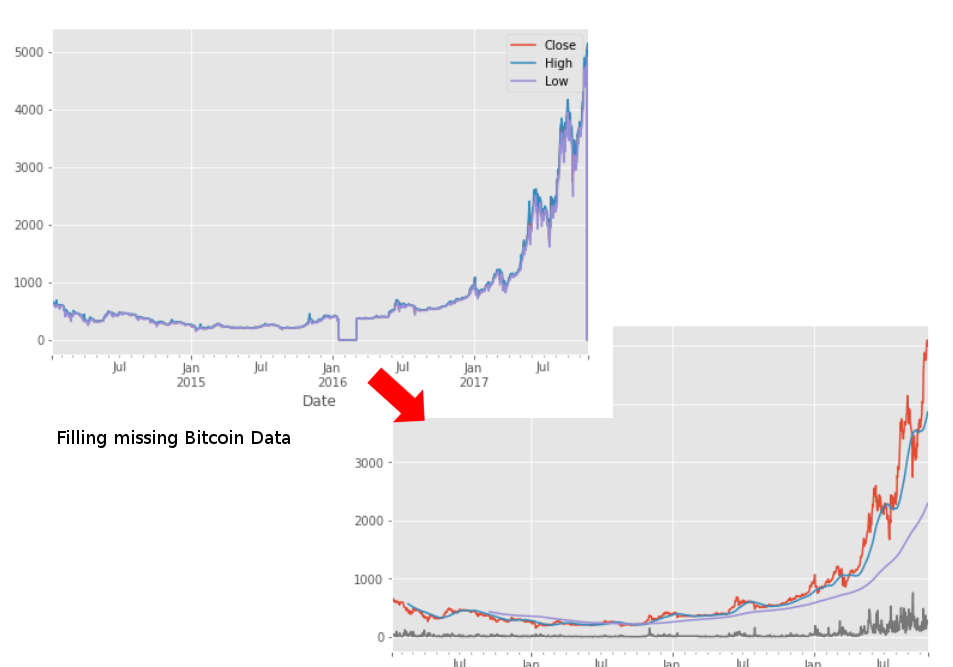
04: Fill NA Values
The fourth door shows how to fill missing values with the average in a bitcoin trend analysis:
btc = btc.replace(0, np.nan).fillna(method='ffill')
It basically replace all zeros with np.NotaNumber and then fills them with the average.
Link to the Jupyter Notebook
Further reading:
Pandas Documentation
Software used:
- Python
- Pandas
- Quandl
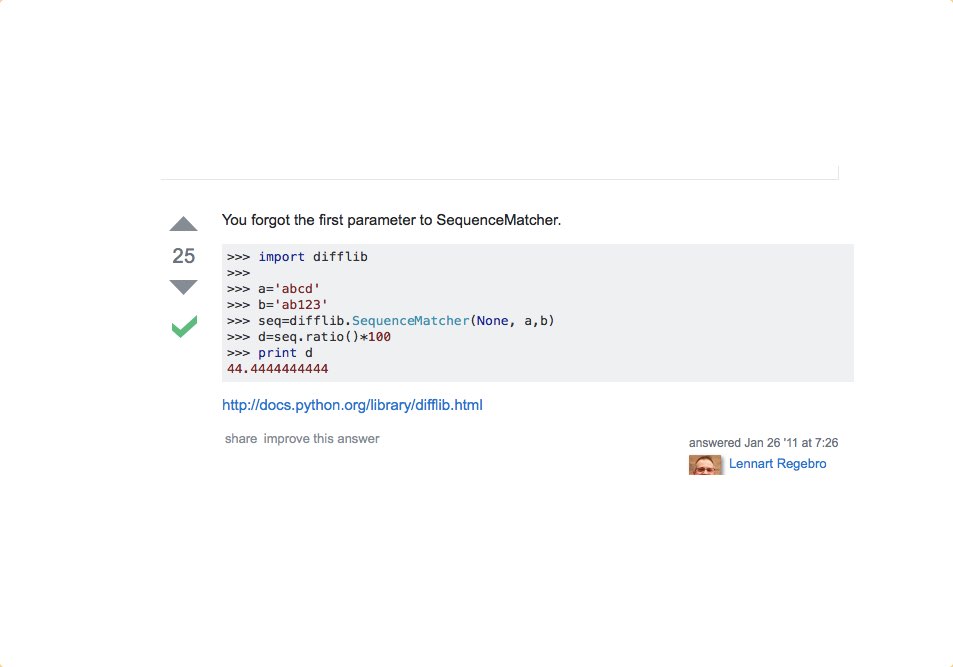
05: Find similarity between two strings
The fifth door shows how to get a percentage, that shows the similarity between two strings:
>>> import difflib
>>> a='John Doe'
>>> b='John Door'
>>> seq=difflib.SequenceMatcher(None, a,b)
>>> d=seq.ratio()
>>> print (d)
0.8235294117647058
Source
Software used:
- Python
- difflib
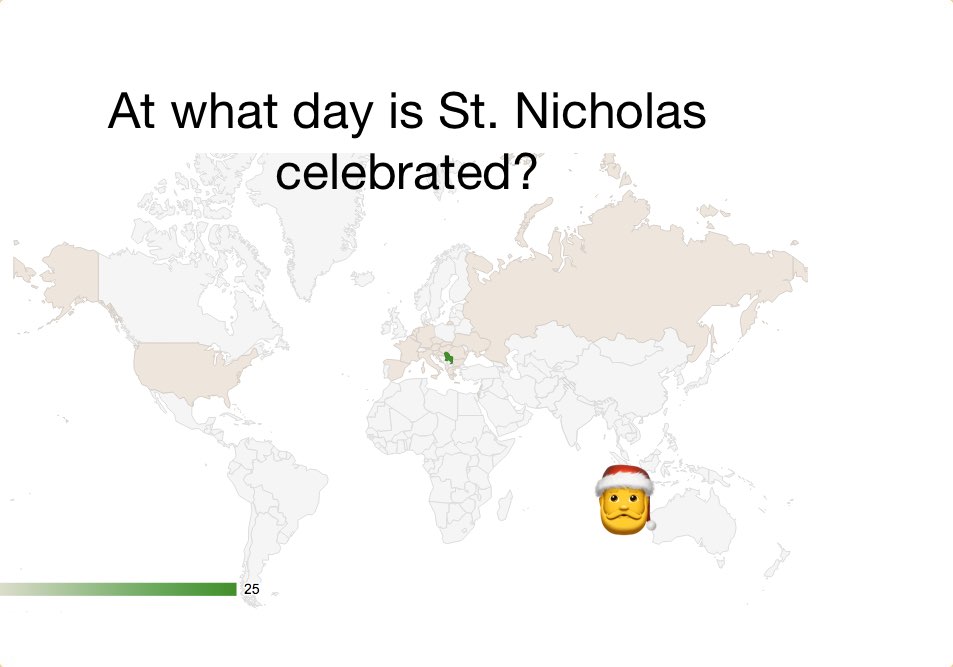
06: At what day is St. Nicholas celebrated
The sixth door shows how to do a rapid prototype of geodata.
At what day is St. Nicholas celebrated
In less then 20 minutes I could take the data from Wikipedia and edit the HTML.
A Google Maps API-Key may be needed.
Software used:
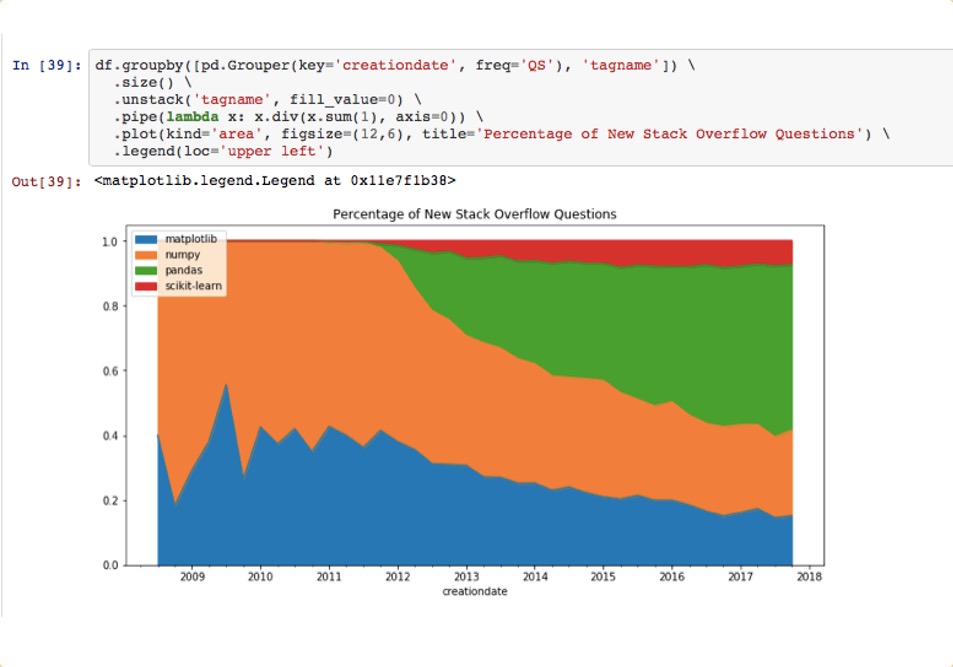
07: Discover emerging trends
The seventh door shows how to discover emerging trends.
Here is the Jupyter Notebook for it.
df.groupby([pd.Grouper(key='creationdate', freq='QS'), 'tagname']) \
.size() \
.unstack('tagname', fill_value=0) \
.pipe(lambda x: x.div(x.sum(1), axis=0)) \
.plot(kind='area', figsize=(12,6), title='Percentage of New Stack Overflow Questions') \
.legend(loc='upper left')
Thanks very much to Theodore Petrou, the author of the Pandas Cookbook for sending me this line of code :)
Software used:
- Python
- Pandas
- glob
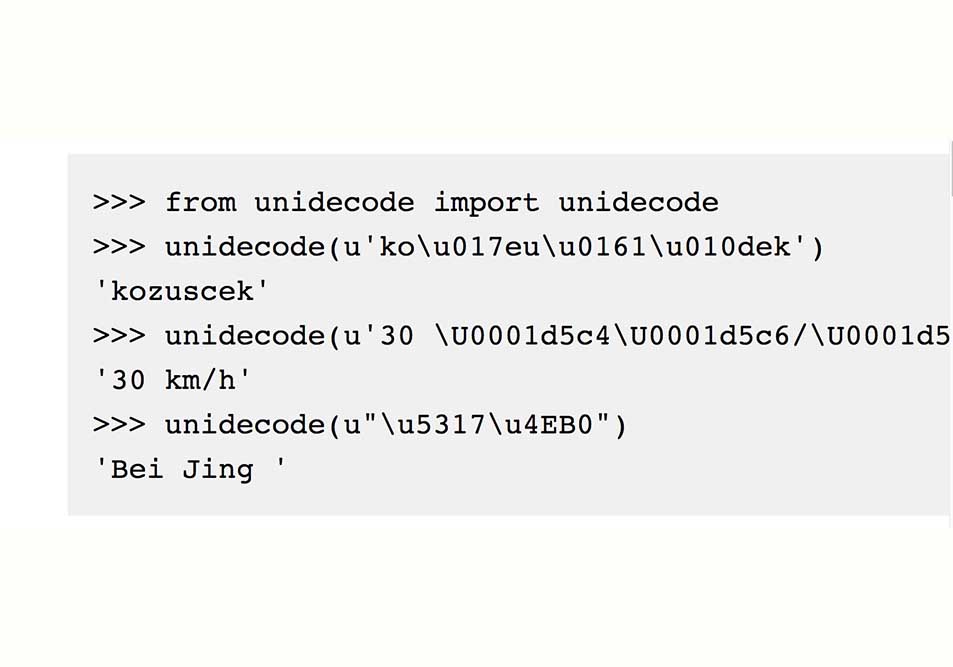
08: Remove accents in Python
The eights door shows how to remove accents in Python. This can be very useful for cleaning data
# The example string is of type 'unicode'
accented_string = u'Málaga'
import unidecode
unaccented_string = unidecode.unidecode(accented_string)
# unaccented_string contains 'Malaga'and is of type 'str'
Source: Christian Oudard
Software used:
- Python
- unidecode
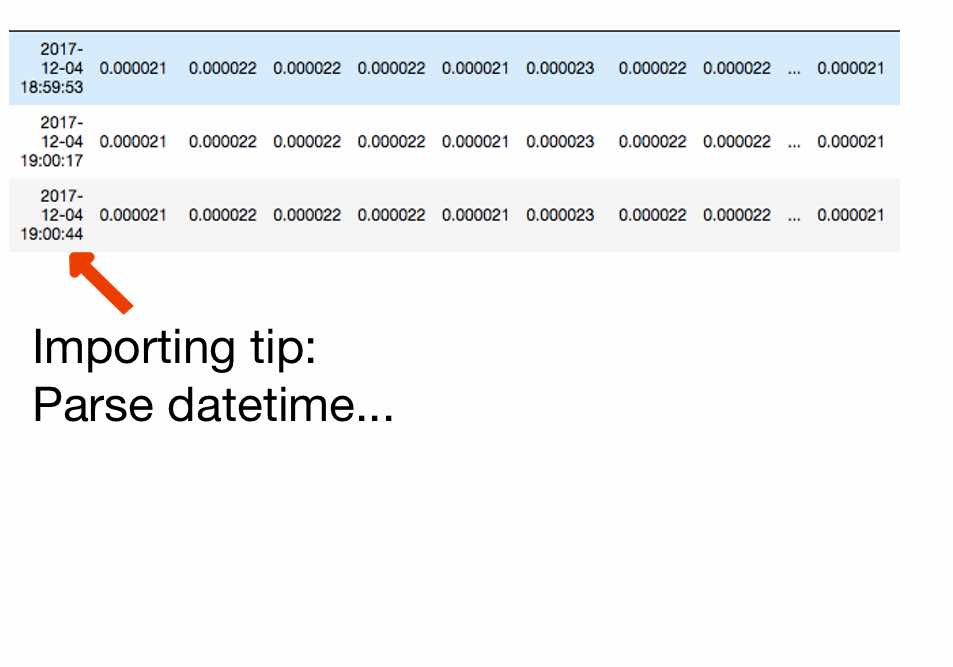
09: Import csv with timeseries
The ninth door shows how to import csv files and make the date a datetime obeject.
Here is the documentation, but you don't find much about it.
The example:
timeformat = lambda x: pd.datetime.strptime(x, '%Y-%m-%d')
pd.read_csv('date_example.csv', parse_dates=['date'], date_parser=timeformat)
Thanks very much to Theodore Petrou, the author of the Pandas Cookbook for sending me this line of code :)
Software used:
- Python
- Pandas
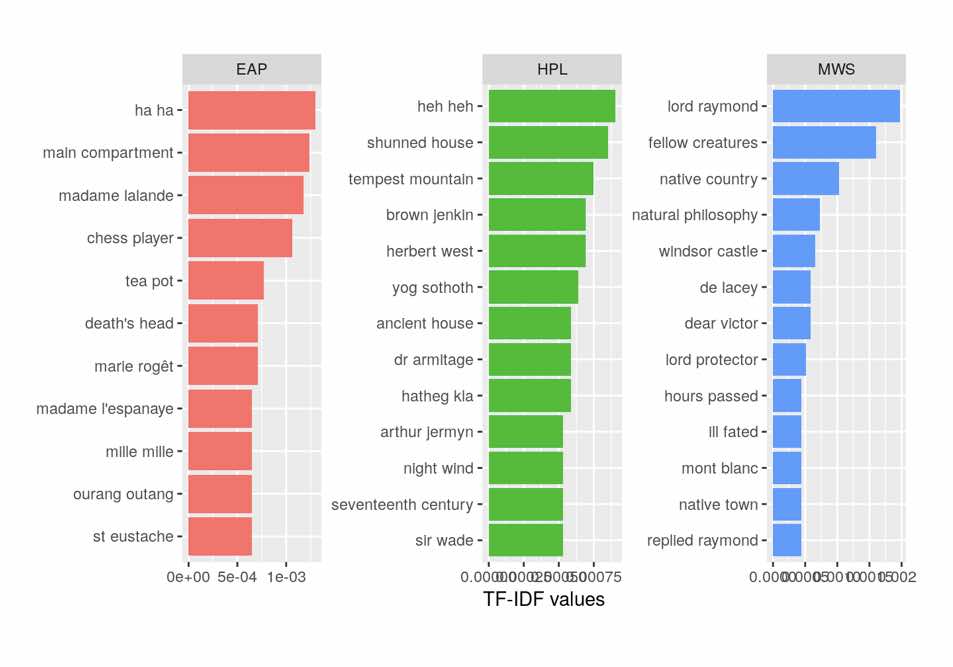
10: Bigrams, bigrams
The tenth door shows how to show frequencies of bigrams.
import nltk
f = open('a_text_file')
raw = f.read()
tokens = nltk.word_tokenize(raw)
bgs = nltk.bigrams(tokens)
nltk.FreqDist(bgs)
Source:
Code and Image from the great EDA of horror books
Software used:
- Python
- Pandas
- NLTK
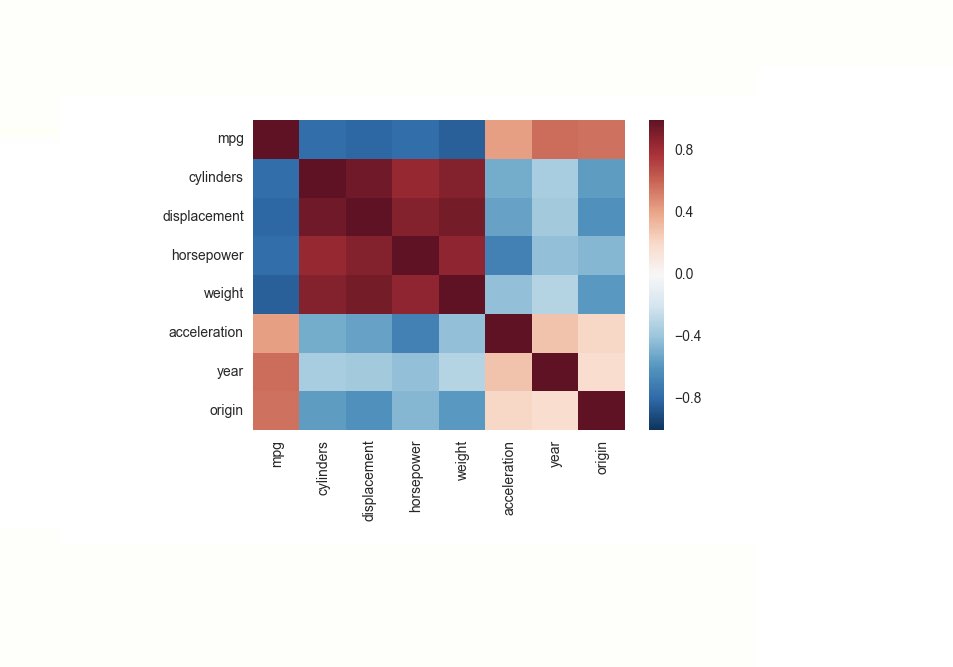
11: Correlation heatmap
The eleventh door shows how to do a simple correlation heatmap.
I like the immediate visual experencie of formal data.
import seaborn as sns
corr = dataframe.corr()
sns.heatmap(corr,
xticklabels=corr.columns.values,
yticklabels=corr.columns.values)
Source from StackOverflow User:
Rafael Valle and Image from this post
Software used:
- Python
- Pandas
- Seaborn
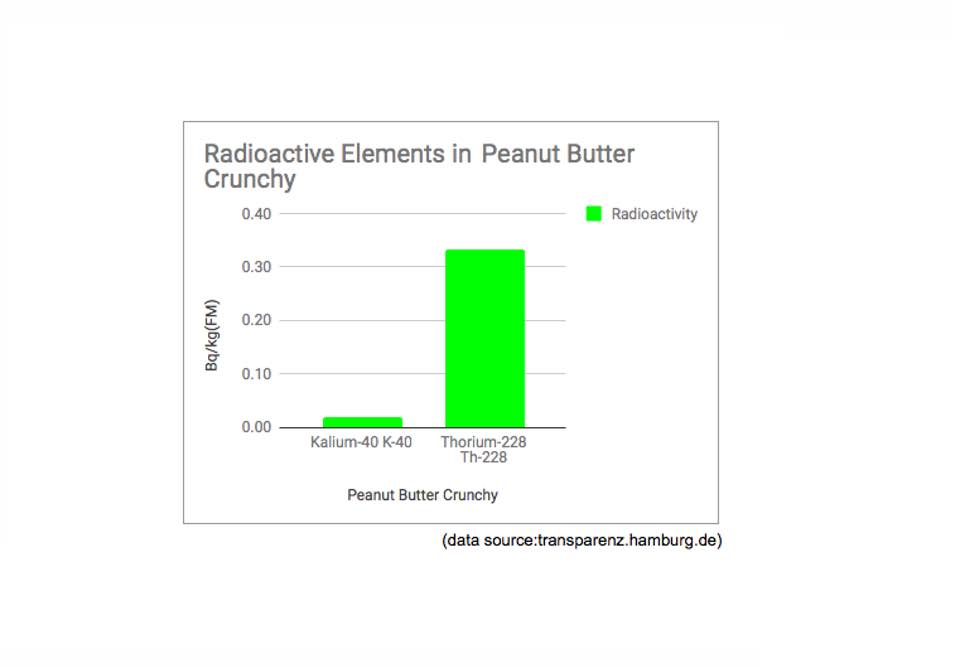
12: Chart Radioactive elements in peanut butter crunchy
The twelth door shows what radio elements could be found in peanut butter. Yes, in peanut butter. I found this during a research session and had to share it :)
Data Source and sheet with chart
Software used:
- Hamburg Transparenz Portal
- Google Sheets
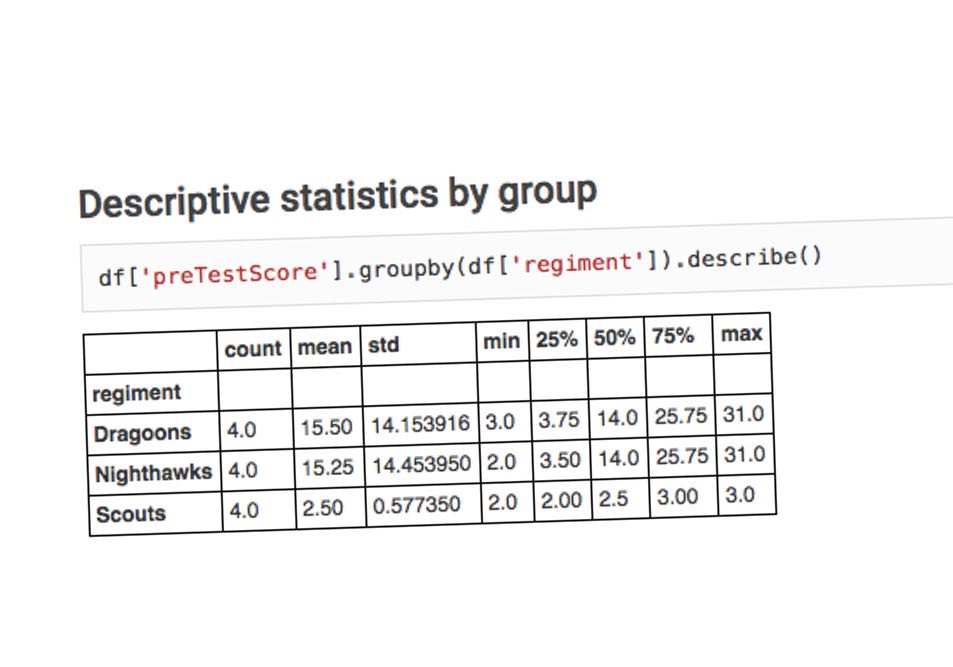
13: Groupby Statistics
The thirteenth door shows how easy you can group in Pandas
df['preTestScore'].groupby(df['regiment']).describe()
Source
Software used:
- Python
- Pandas
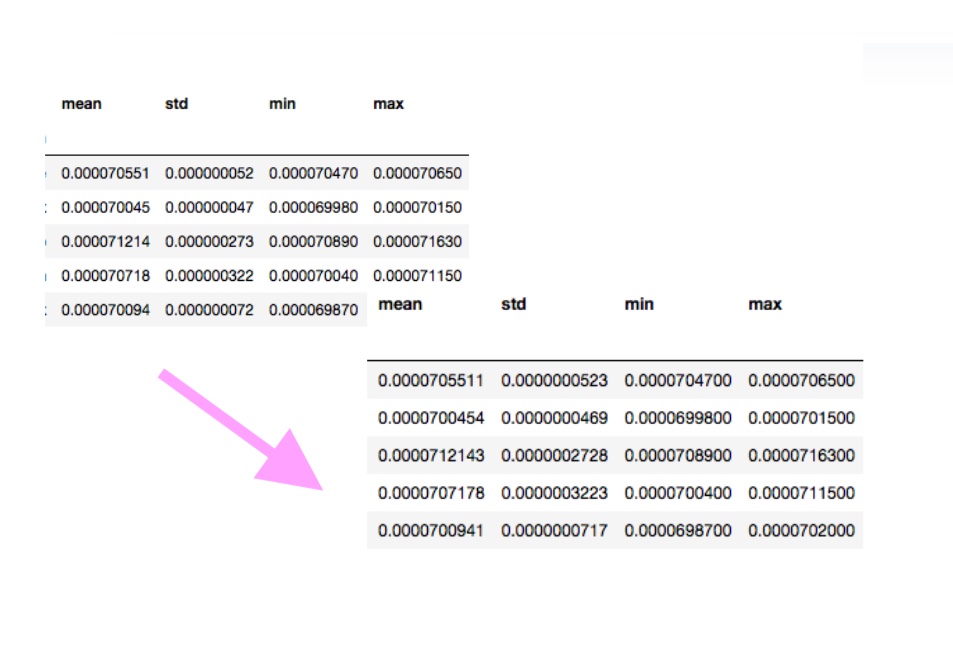
15: Formatting Floats
When working with floats sometimes the number is so small you need to specify the number of values to display:
pd.options.display.float_format = '${:,.2f}'.format
Source: Unutbu
Software used:
- Python
- RegEx
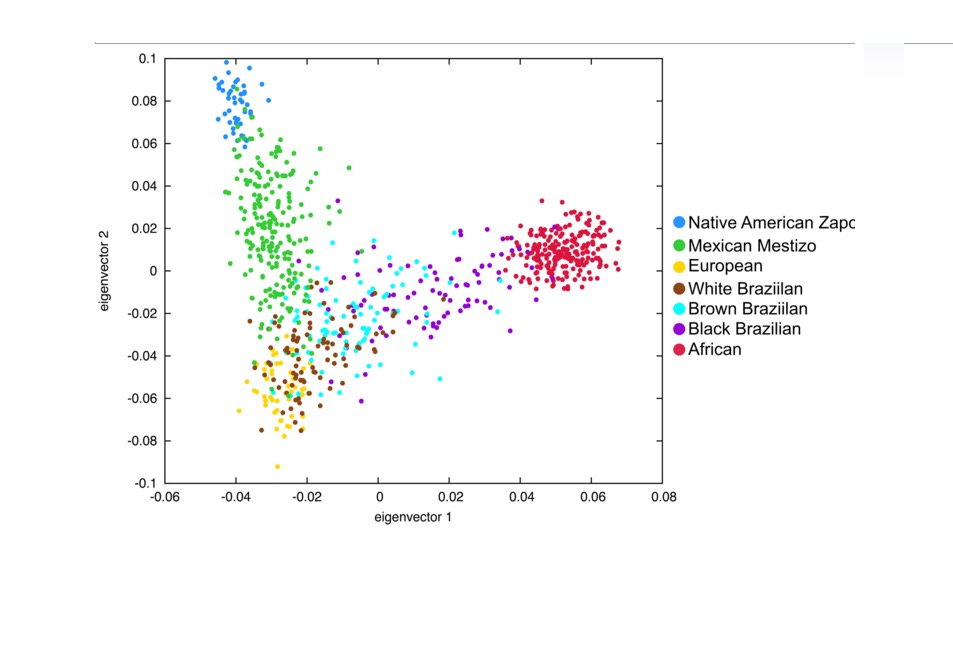
16: Short PCAs
The sixteenth door shows how to do a PCA in one line:
from sklearn.decomposition import PCA
PCA(n_components = 4).fit_transform(data)
It basically replace all zeros with np.NotaNumber and then fills them with the average.
Join the discussion
Software used:
- Python
- sklearn
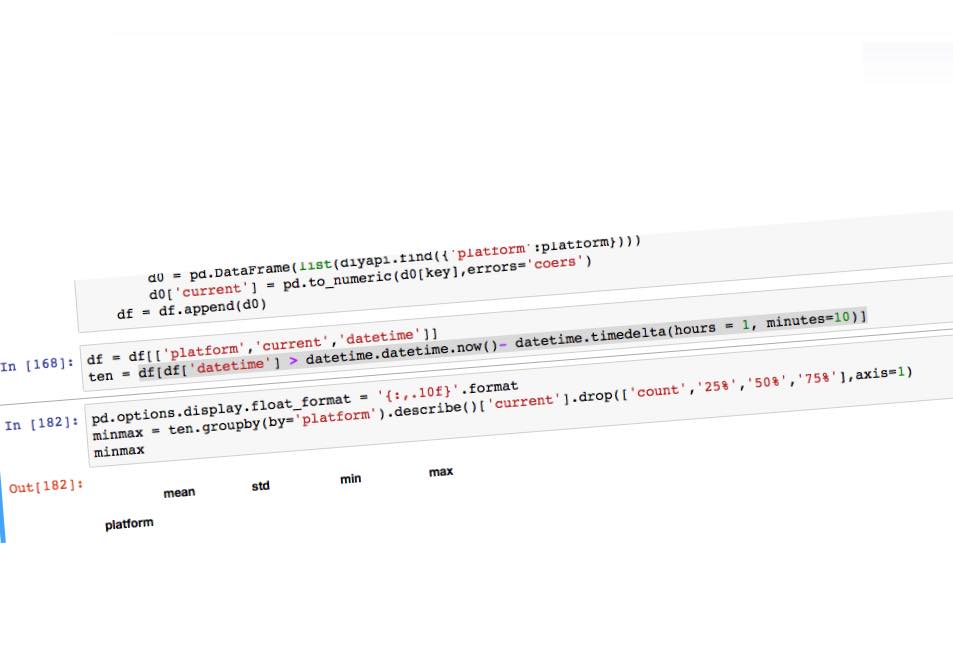
17: Timeseries. Get rows that were created in the last hour
The seventeenth door shows how to get rows that were created in the last hour:
df[df['datetime'] > datetime.datetime.now()- datetime.timedelta(hours = 1, minutes=10)]
Software used:
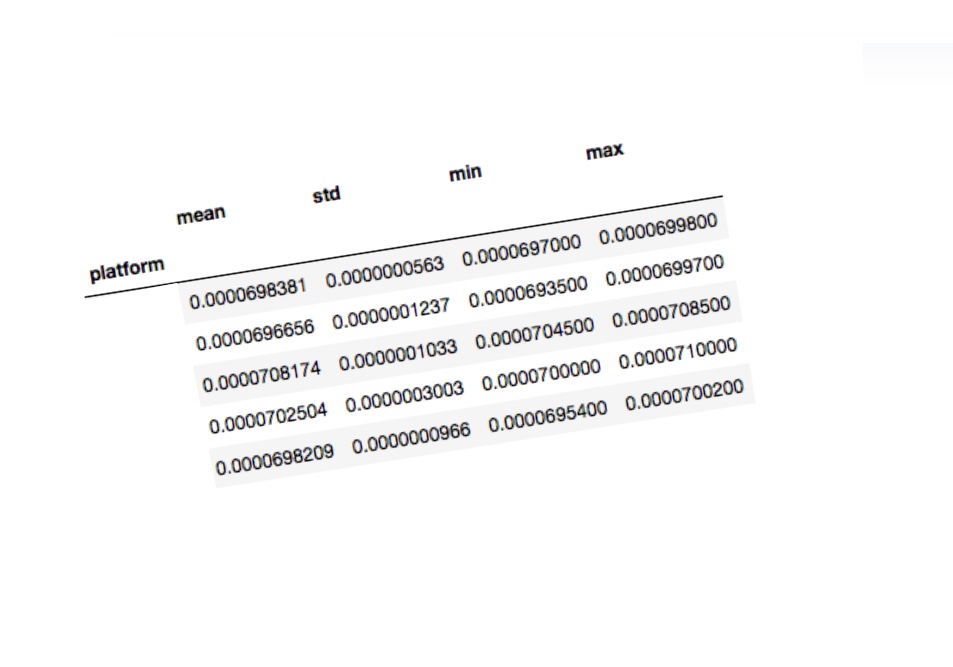
18: Sort by minimum or maximum
The eighteenth door shows is a simple way of applying groupby and describe.
df.groupby(by='platform').describe().sort_values(by='min')
Software used:
- Python
- Pandas
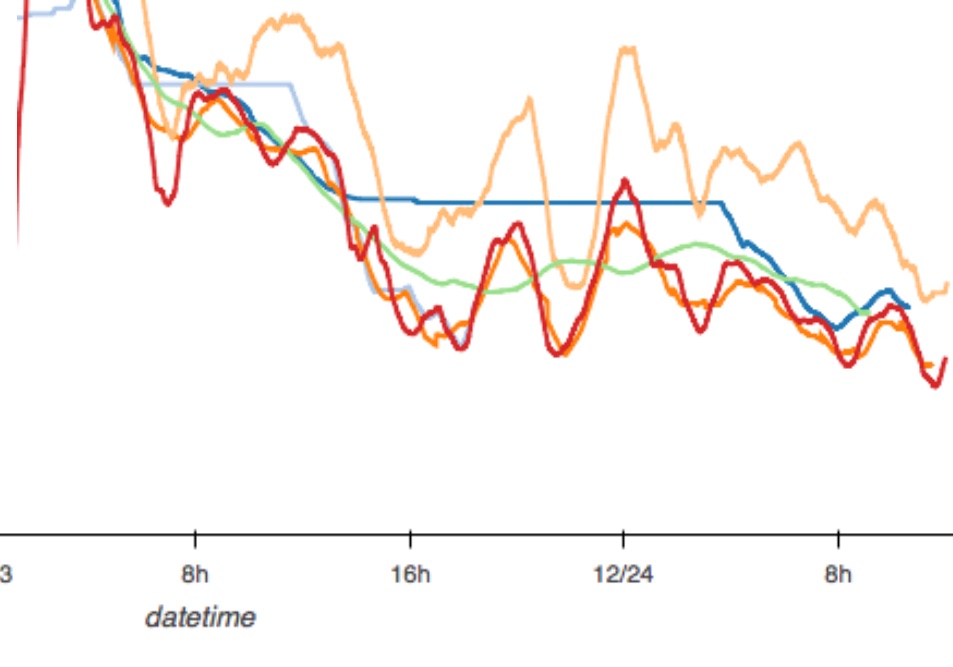
19: Rolling average in Holoviews
The nineteenth door shows how to apply rolling averages in holoviews to smooth out curves.
import holoviews as hv
from holoviews.operation.timeseries import rolling
hv.extension('bokeh')
xs = df[x]
ys = df[y]
curve = hv.Curve((xs, ys))
avg_curve = rolling(curves2, rolling_window=1200).relabel('Average')
avg_curve
Software used:
- Python
- Holoviews
- Pandas
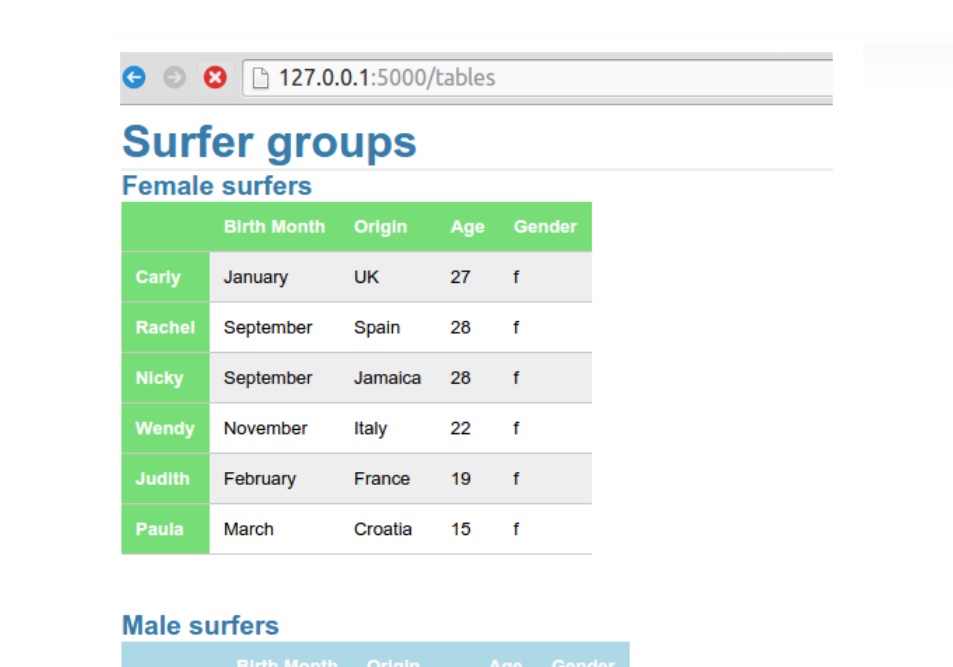
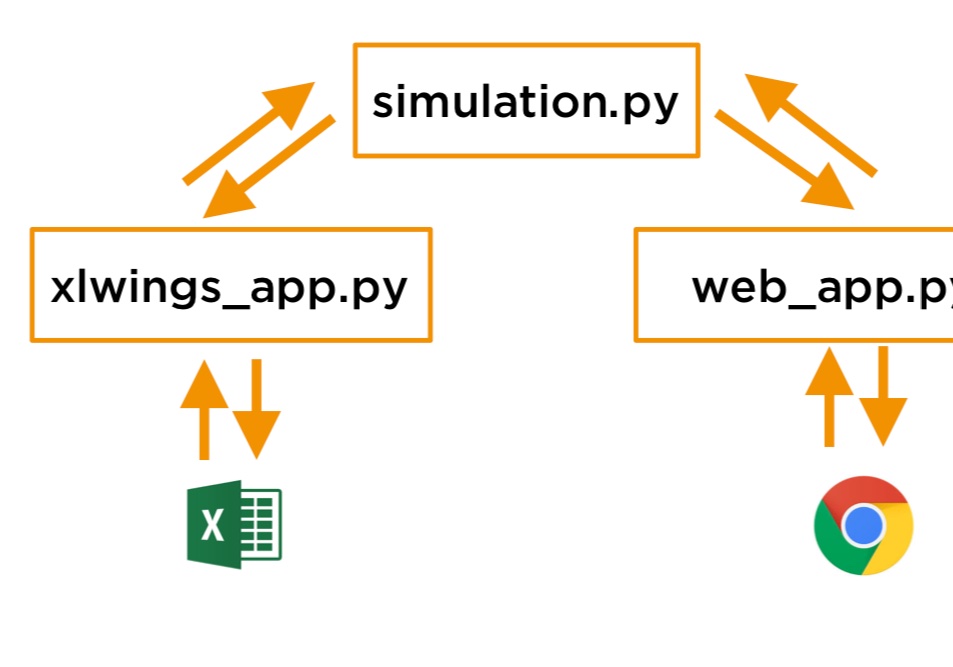
20: Display simple tables as a web app using flask
The tweentieh door shows how to display a dataframe as a HTML Table
Try it yourself below:
Source: Sarah Lee Jane
Software used:
- Python
- Flask
- Pandas
21: Book recommendation
This door is book recommendation for my favorite book.
Written by the creator of Pandas
Books used:
- Python for Data Analysis
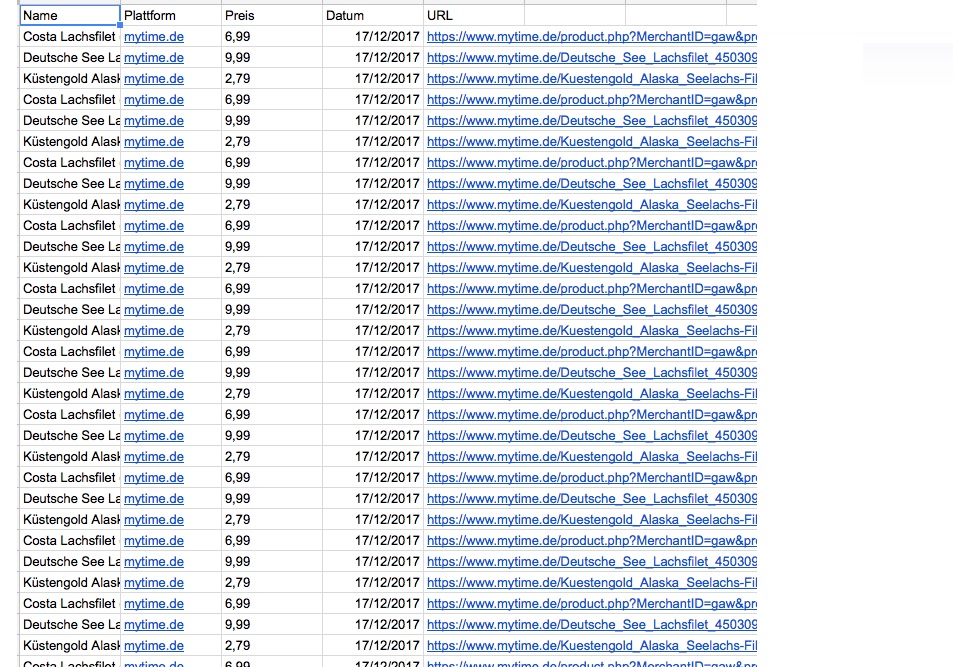
22: Simple Scraper in Google Sheets
With Google Appscript it is also possible to archive data.
Link:
Google Sheets
Software used:
- Google Sheets
- Google App Script

24: Find similiar repos by looking other Stargazers stars
This is my special present for all the explorers
Github Repo Recommender
Software used:
- Python
- Pandas
- Github API